How Thread Glass Works
Thread Glass attaches to a running JVM process, captures thread state and runtime signals, evaluates conditions like deadlocks, lock contention, memory pressure, and GC stress, then summarizes findings into a clear health report.
Output is available as readable terminal text or structured data for automation pipelines.
For full setup and usage details, open the Thread Glass User Guide (PDF).
Terminal
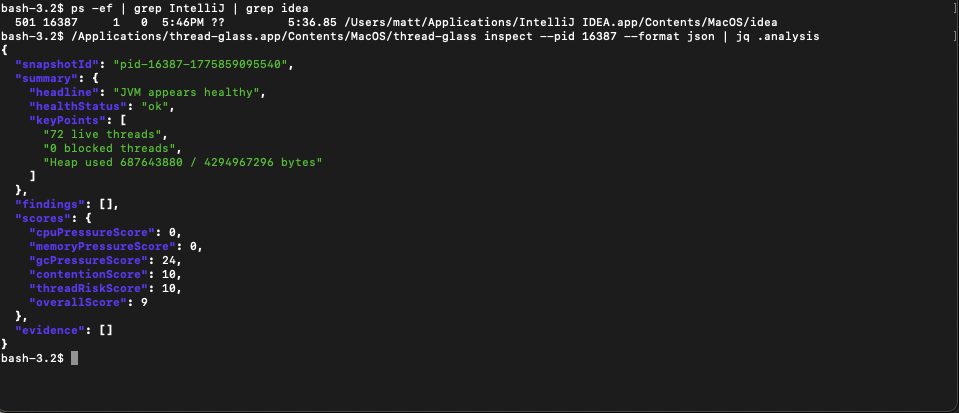
Scroll through what a full report would look like here
example-report.json
{
  "schemaVersion": "1.0",
  "snapshot": {
    "schemaVersion": "1.0",
    "snapshotId": "snap-example-001",
    "capturedAt": "2026-04-10T16:00:00Z",
    "source": {
      "type": "localPid",
      "description": "PID 12345"
    },
    "target": {
      "pid": 12345,
      "displayName": "ExampleService",
      "jvmName": "OpenJDK 64-Bit Server VM",
      "jvmVendor": "Eclipse Adoptium",
      "jvmVersion": "21.0.2",
      "startTime": "2026-04-10T13:45:00Z",
      "uptimeMs": 8100000,
      "host": "example-host"
    },
    "capabilities": {
      "canReadThreads": true,
      "canReadThreadCpuTime": true,
      "canReadAllocatedBytes": false,
      "canDetectDeadlocks": true,
      "canReadMemory": true,
      "canReadGc": true,
      "canReadClassLoading": true,
      "canReadCompilation": true,
      "canReadSystemProperties": true,
      "canStartJfr": true
    },
    "collectionPlan": {
      "includeThreads": true,
      "includeMemory": true,
      "includeGarbageCollection": true,
      "includeClassLoading": true,
      "includeCompilation": true,
      "includeRuntime": true,
      "includeSystemProperties": false,
      "includeJfr": true,
      "includeThreadDump": true,
      "includeDeadlockCheck": true,
      "sampleDurationMs": 3000,
      "sampleIntervalMs": 250,
      "timeoutMs": 5000
    },
    "runtime": {
      "vmName": "OpenJDK 64-Bit Server VM",
      "vmVendor": "Eclipse Adoptium",
      "vmVersion": "21.0.2",
      "specName": "Java Virtual Machine Specification",
      "specVendor": "Oracle Corporation",
      "specVersion": "21",
      "managementSpecVersion": "3.0",
      "inputArguments": [
        "-Xms512m",
        "-Xmx2g",
        "-XX:+UseG1GC"
      ],
      "systemProperties": {
        "java.version": "21.0.2",
        "user.timezone": "UTC"
      },
      "bootClassPathSupported": false
    },
    "os": {
      "name": "Mac OS X",
      "arch": "aarch64",
      "version": "15.0",
      "availableProcessors": 10,
      "systemLoadAverage": 2.34
    },
    "memory": {
      "heap": {
        "initBytes": 536870912,
        "usedBytes": 1610612736,
        "committedBytes": 1879048192,
        "maxBytes": 2147483648
      },
      "nonHeap": {
        "initBytes": 7667712,
        "usedBytes": 132120576,
        "committedBytes": 145752064,
        "maxBytes": 268435456
      },
      "pools": [
        {
          "name": "G1 Eden Space",
          "type": "heap",
          "usage": {
            "initBytes": 268435456,
            "usedBytes": 402653184,
            "committedBytes": 536870912,
            "maxBytes": 805306368
          },
          "peakUsage": {
            "initBytes": 268435456,
            "usedBytes": 469762048,
            "committedBytes": 536870912,
            "maxBytes": 805306368
          },
          "collectionUsage": {
            "initBytes": 268435456,
            "usedBytes": 134217728,
            "committedBytes": 536870912,
            "maxBytes": 805306368
          },
          "usageThresholdSupported": false,
          "collectionUsageThresholdSupported": true
        },
        {
          "name": "G1 Old Gen",
          "type": "heap",
          "usage": {
            "initBytes": 268435456,
            "usedBytes": 1207959552,
            "committedBytes": 1207959552,
            "maxBytes": 1342177280
          },
          "peakUsage": {
            "initBytes": 268435456,
            "usedBytes": 1258291200,
            "committedBytes": 1207959552,
            "maxBytes": 1342177280
          },
          "collectionUsage": {
            "initBytes": 268435456,
            "usedBytes": 1006632960,
            "committedBytes": 1207959552,
            "maxBytes": 1342177280
          },
          "usageThresholdSupported": true,
          "collectionUsageThresholdSupported": true
        }
      ]
    },
    "garbageCollection": {
      "collectors": [
        {
          "name": "G1 Young Generation",
          "collectionCount": 48,
          "collectionTimeMs": 930,
          "memoryPoolNames": [
            "G1 Eden Space",
            "G1 Survivor Space",
            "G1 Old Gen"
          ]
        },
        {
          "name": "G1 Old Generation",
          "collectionCount": 3,
          "collectionTimeMs": 410,
          "memoryPoolNames": [
            "G1 Eden Space",
            "G1 Survivor Space",
            "G1 Old Gen"
          ]
        }
      ],
      "totalCollectionCount": 51,
      "totalCollectionTimeMs": 1340,
      "recentGcOverheadPercent": 12.8
    },
    "threads": {
      "threadCount": 182,
      "daemonThreadCount": 168,
      "peakThreadCount": 190,
      "totalStartedThreadCount": 1543,
      "deadlockedThreadIds": [],
      "threads": [
        {
          "id": 41,
          "name": "http-nio-8080-exec-7",
          "state": "RUNNABLE",
          "daemon": true,
          "priority": 5,
          "cpuTimeNs": 824000000,
          "userTimeNs": 701000000,
          "blockedCount": 12,
          "blockedTimeMs": 48,
          "waitedCount": 130,
          "waitedTimeMs": 992,
          "lockName": null,
          "lockOwnerId": null,
          "lockOwnerName": null,
          "inNative": false,
          "suspended": false,
          "stackTrace": [
            {
              "className": "com.example.service.RequestHandler",
              "methodName": "handle",
              "fileName": "RequestHandler.java",
              "lineNumber": 148,
              "nativeMethod": false
            },
            {
              "className": "java.lang.Thread",
              "methodName": "run",
              "fileName": "Thread.java",
              "lineNumber": 1583,
              "nativeMethod": false
            }
          ],
          "lockedMonitors": [],
          "lockedSynchronizers": []
        },
        {
          "id": 77,
          "name": "ForkJoinPool.commonPool-worker-3",
          "state": "BLOCKED",
          "daemon": true,
          "priority": 5,
          "cpuTimeNs": 110000000,
          "userTimeNs": 92000000,
          "blockedCount": 84,
          "blockedTimeMs": 4412,
          "waitedCount": 212,
          "waitedTimeMs": 6921,
          "lockName": "java.lang.Object@2f4a1c8b",
          "lockOwnerId": 12,
          "lockOwnerName": "main",
          "inNative": false,
          "suspended": false,
          "stackTrace": [
            {
              "className": "com.example.cache.CacheCoordinator",
              "methodName": "refresh",
              "fileName": "CacheCoordinator.java",
              "lineNumber": 87,
              "nativeMethod": false
            }
          ],
          "lockedMonitors": [
            {
              "className": "java.lang.Object",
              "identityHashCode": 793386123,
              "lockedStackDepth": 0
            }
          ],
          "lockedSynchronizers": [
            {
              "className": "java.util.concurrent.locks.ReentrantLock$NonfairSync",
              "identityHashCode": 19384756
            }
          ]
        }
      ],
      "groupedStacks": [
        {
          "fingerprint": "runnable-com-example-service-requesthandler",
          "threadCount": 24,
          "representativeThreadName": "http-nio-8080-exec-7",
          "state": "RUNNABLE",
          "topFrames": [
            {
              "className": "com.example.service.RequestHandler",
              "methodName": "handle",
              "fileName": "RequestHandler.java",
              "lineNumber": 148,
              "nativeMethod": false
            }
          ]
        }
      ],
      "lockContention": [
        {
          "lockName": "java.lang.Object@2f4a1c8b",
          "ownerThreadId": 12,
          "ownerThreadName": "main",
          "blockedThreadIds": [
            77,
            83,
            91
          ],
          "blockedThreadNames": [
            "ForkJoinPool.commonPool-worker-3",
            "ForkJoinPool.commonPool-worker-5",
            "ForkJoinPool.commonPool-worker-7"
          ]
        }
      ]
    },
    "classLoading": {
      "loadedClassCount": 18432,
      "totalLoadedClassCount": 19287,
      "unloadedClassCount": 855
    },
    "compilation": {
      "compilerName": "HotSpot 64-Bit Tiered Compilers",
      "compilationTimeMonitoringSupported": true,
      "totalCompilationTimeMs": 38422
    },
    "jfr": {
      "recordingDurationMs": 3000,
      "eventCounts": {
        "jdk.ExecutionSample": 812,
        "jdk.JavaMonitorEnter": 19,
        "jdk.ObjectAllocationInNewTLAB": 224
      },
      "hotMethods": [
        {
          "method": "com.example.service.RequestHandler.handle",
          "sampleCount": 217,
          "percentage": 26.7
        }
      ],
      "allocationHotspots": [
        {
          "typeName": "byte[]",
          "allocationCount": 18432,
          "allocationBytes": 94371840
        }
      ],
      "latencySignals": [
        {
          "name": "request-latency",
          "count": 1280,
          "p50Ms": 12.4,
          "p95Ms": 148.8,
          "p99Ms": 322.1
        }
      ],
      "exceptions": [
        {
          "typeName": "java.util.concurrent.TimeoutException",
          "count": 14,
          "messageSample": "operation timed out"
        }
      ]
    },
    "warnings": [
      {
        "code": "partial-collection",
        "message": "Allocated bytes were not available on this target."
      }
    ],
    "errors": [
      {
        "category": "partialCollection",
        "message": "One optional subsystem did not expose complete data."
      }
    ],
    "rawArtifacts": [
      {
        "path": "artifacts/thread-dump.txt",
        "mediaType": "text/plain",
        "sha256": "0123456789abcdef0123456789abcdef0123456789abcdef0123456789abcdef"
      }
    ]
  },
  "analysis": {
    "snapshotId": "snap-example-001",
    "summary": {
      "headline": "Java process is under elevated memory and contention pressure",
      "healthStatus": "degraded",
      "keyPoints": [
        "182 live threads",
        "3 threads blocked on one hot lock",
        "Heap usage is 75% of max",
        "Garbage collection overhead is elevated"
      ]
    },
    "findings": [
      {
        "id": "heap-pressure",
        "category": "memory",
        "severity": "medium",
        "confidence": "high",
        "title": "Heap pressure is elevated",
        "description": "Heap usage is above the configured warning threshold.",
        "recommendation": "Inspect allocation rate and retained objects.",
        "evidenceRefs": [
          "ev-heap-1"
        ]
      },
      {
        "id": "contention",
        "category": "threads",
        "severity": "medium",
        "confidence": "medium",
        "title": "Lock contention is elevated",
        "description": "Multiple threads are blocked waiting for the same monitor.",
        "recommendation": "Inspect lock ownership and synchronized regions.",
        "evidenceRefs": [
          "ev-contention-1"
        ]
      }
    ],
    "scores": {
      "cpuPressureScore": 10,
      "memoryPressureScore": 20,
      "gcPressureScore": 13,
      "contentionScore": 25,
      "threadRiskScore": 25,
      "overallScore": 19
    },
    "evidence": [
      {
        "id": "ev-heap-1",
        "kind": "memoryPoolThreshold",
        "title": "Heap usage above threshold",
        "details": "Heap usage is 75.0% of max.",
        "severityHint": "medium",
        "data": {
          "usedPercent": 75,
          "usedBytes": 1610612736,
          "maxBytes": 2147483648
        }
      },
      {
        "id": "ev-contention-1",
        "kind": "blockedThreads",
        "title": "Blocked thread cluster detected",
        "details": "Three worker threads are blocked on the same lock.",
        "severityHint": "medium",
        "data": {
          "lockName": "java.lang.Object@2f4a1c8b",
          "blockedThreadCount": 3
        }
      }
    ]
  }
}